

A B2B whitepaper can take weeks to produce. Research is gathered, findings are reviewed, and several rounds of revisions follow. By the time it’s published, a considerable amount of work has gone into it.
Yet whitepaper design is often treated as the final stage of production, leaving little room to question the document itself. Is the argument clear? Are the findings worth highlighting? And how much of that work is actually useful to the reader?
People reading a whitepaper need to find relevant information, understand the evidence, and decide whether the findings are worth sharing with their colleagues.
A longer report needs a better reason to exist
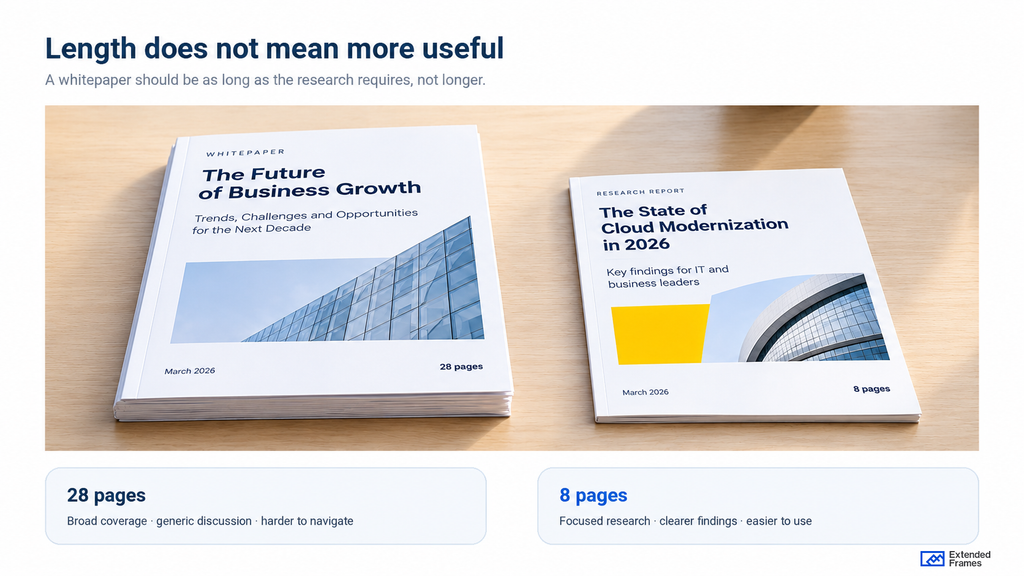
There is a tendency in B2B marketing to associate depth with length. More pages suggest more research, more expertise, and greater value. But a 28-page report filled with familiar industry observations may offer less useful information than a focused eight-page study.
Length should follow the research and the questions it can answer.
Consider a technology company preparing a whitepaper on AI adoption.
The Future of AI in Enterprise Business is a broad subject. It could easily become a collection of industry forecasts, familiar challenges, and recommendations that apply to almost any organization.
A more useful research question might be: Why are enterprise AI pilots struggling to reach production, and which operational decisions contribute to the delays?
That gives the report something specific to investigate. It also creates an opportunity to examine competing explanations rather than settling for general commentary.
Of course, the company would need credible research to answer that question. An interesting title cannot compensate for evidence that was never collected.
The 2025 Edelman–LinkedIn B2B Thought Leadership Impact Report found that B2B audiences, including stakeholders outside the immediate purchasing conversation, value material that informs or challenges their existing perspectives.
The research covers thought leadership broadly, rather than whitepapers specifically. Its relevance here is the expectation it reveals: readers are looking for useful thinking, particularly when evaluating complex business decisions.
A report should therefore begin with a subject that warrants investigation, supported by findings that justify asking someone to spend time reading it.
Where the argument starts falling apart
A whitepaper can lose its direction long before anyone opens the design file.
Research teams contribute findings. Product marketing wants to reinforce positioning. Sales asks for examples that address customer objections. Senior stakeholders request additional context.
Those contributions may all be reasonable individually. The difficulty is when nobody is willing to decide what belongs in the report and what should be left out.
Consider an illustrative 24-page report on enterprise AI adoption. The research identifies three significant implementation challenges, but the published draft gives equal attention to company background, industry forecasts, product capabilities, and general technology trends.
The findings that prompted the research are buried halfway through the document. A designer can give those pages greater visual emphasis. But the editorial team still needs to decide which findings deserve prominence and whether the surrounding material contributes anything useful.
Separate the finding from the interpretation
Suppose a survey indicates that organizations with established data governance procedures report fewer delays in AI deployment.
That is a finding, assuming the research has been conducted and reported correctly. Concluding that governance procedures caused the reduction in delays requires additional evidence.
This distinction is easy to lose when a statistic becomes a bold headline. Before approving a major statement, the editorial team should examine what the research actually establishes, which qualifications are necessary, and whether the wording goes beyond the evidence.
The same applies to vendor-sponsored research. Readers deserve to know how the study was conducted and where commercial interests may influence its interpretation.
A whitepaper becomes harder to trust when its conclusions are more confident than its evidence.
What whitepaper design can improve, and what it cannot
Once the argument is sound, design has substantial work to do.
A designer needs to establish the reading order, organize related information, decide where comparisons need visual explanation, and create a consistent document that people can navigate without constantly searching for context.
Those decisions are often more demanding than choosing a typeface or applying brand colors.
Let’s return to the hypothetical AI adoption report. The same research could be presented in very different ways.
| Part of the report | Conventional treatment | More useful treatment |
|---|---|---|
| Opening pages | Company introduction and industry background | Research question, significant findings, and scope |
| Findings | Statistics embedded throughout long paragraphs | Findings grouped around the questions investigated |
| Charts | Large percentages presented individually | Comparisons with labels, timeframes, and methodology notes |
| Section headings | General labels such as “Key Insights” | Descriptive headings that tell readers what each section covers |
| Supporting evidence | Technical details scattered throughout | Relevant details alongside findings, with deeper methodology in an appendix |
| Final pages | A broad summary followed by a product pitch | Conclusions supported by the research, followed by relevant next steps |
Illustrative editorial example, not a measured performance comparison.
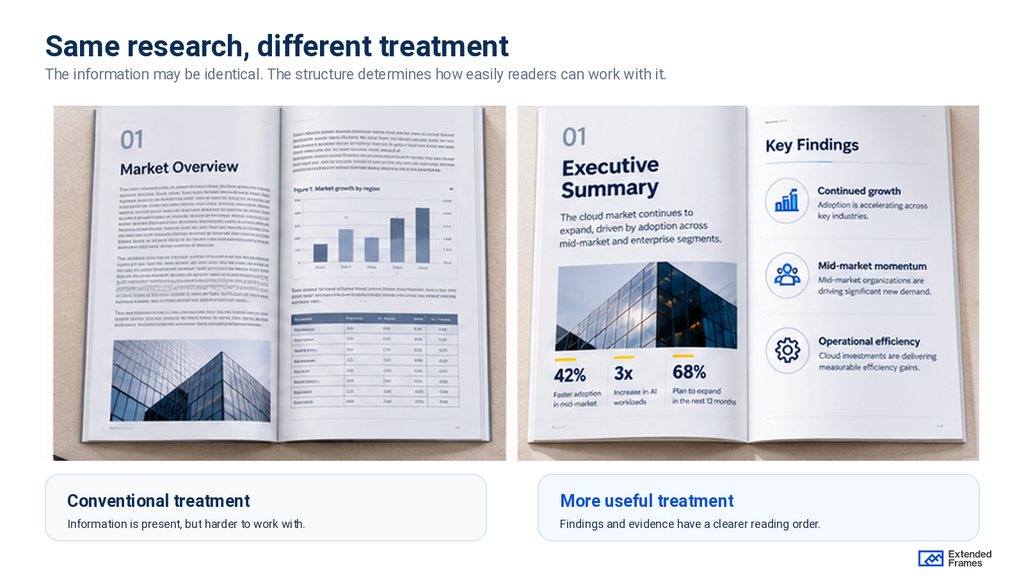
The second approach requires more thought before layout begins. It also gives readers a clearer route through the information.
But there are limits to what design can achieve. If the research is weak, the charts will simply present weak research more attractively. If a conclusion is unsupported, larger typography may make it appear more authoritative without making it more accurate.
Professional design should make the content easier to examine, including its limitations.
Design for the reader who opens page seven first
A whitepaper may be downloaded by someone interested in one finding, forwarded to a colleague, or revisited weeks after publication.
It is unrealistic to expect every reader to begin on page one and continue through the document in sequence.
This changes how the report should be organized. A heading such as Market Challenges identifies a broad topic. Why implementation costs rise after the pilot stage gives readers a more useful indication of what the section contains, provided the research supports that finding.
Navigation should be equally deliberate. For a longer report, a linked table of contents, meaningful section titles, consistent page numbering, and clearly labeled charts help readers return to relevant material.
Give important findings room to be understood
Imagine a page presenting three survey results, two quotations, a photograph, and several paragraphs of explanation.
Making every element prominent creates unnecessary competition for attention. The design team needs to decide what the reader should understand first.
If the page is explaining a difference between two groups, that comparison probably deserves the largest visual area. A quotation that reinforces the same finding may belong nearby. General commentary can be shortened or moved elsewhere.
This is where whitepaper layout becomes an editorial decision. Visual hierarchy should reflect the importance and relationship of the information rather than the order in which content arrived from different contributors.
The same principle applies across complex business communication. Our guide to visual hierarchy in design and presentation looks more closely at how scale, contrast, spacing, and placement establish that reading order.
The same reasoning applies to charts. A large pie chart may make an ordinary percentage feel important, but it offers little help when the reader needs to compare several closely related figures.
A bar chart or a simple table may serve that comparison better.
For a deeper look at choosing chart types and presenting comparisons clearly, see our guide to data visualization in PowerPoint.
Extended Frames’ guide to PowerPoint dashboard design and KPI reporting explores how baselines, comparisons, and reporting periods affect the interpretation of business data.
Those principles apply equally to research reports.
Will the findings hold up outside the report?
This is where whitepaper design becomes particularly relevant to B2B buying decisions.
A report may begin with a marketing contact but reach several other people before a purchasing decision is made.
The 2025 Edelman–LinkedIn research found that 55% of hidden buyers use thought leadership during vendor evaluation, compared with 56% of target buyers.
Hidden buyers can include people in finance, legal, procurement, and operations who influence purchasing decisions without necessarily being the intended users of a product.
That creates an interesting problem for B2B reports. A technical leader may understand an implementation finding immediately. A finance director receiving the same page may need the cost assumptions. Someone in procurement may want to understand the risks or supporting evidence.
The original author won’t always be present to explain the findings.
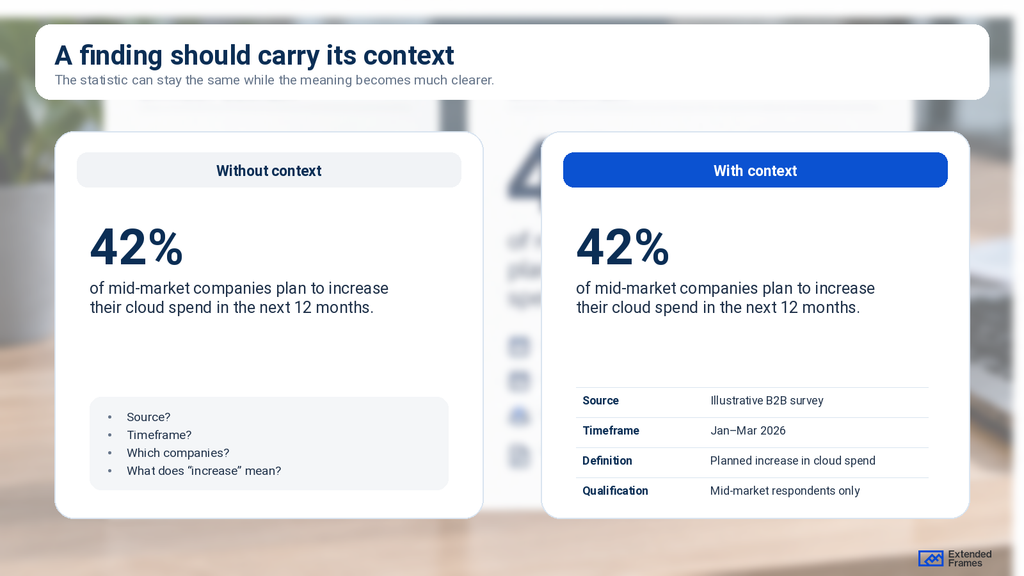
Make a finding understandable when it gets separated from the document
Consider a chart showing that one deployment model has a lower reported operating cost than another.
If the chart is copied into an executive presentation, will the audience know which costs were included, what period was measured, and which organizations were compared?
A footnote buried elsewhere in the report is unlikely to help.
Essential context should travel with the finding. This includes source attribution, relevant definitions, timeframes, and important qualifications. More detailed methodology can remain in a supporting section, but readers should be able to interpret the principal claim without reconstructing the research.
Extended Frames explores similar issues in its article on ESG report design and presenting sustainability data.
The ability to reuse findings also deserves attention during design.
A well-organized report makes it easier to prepare executive summaries, presentation slides, sales materials, and campaign assets without repeatedly rewriting the original research.
Editorial judgment: When a report is likely to circulate across departments, its design should anticipate how individual findings will be extracted and discussed.
A PDF is only one part of the reading experience
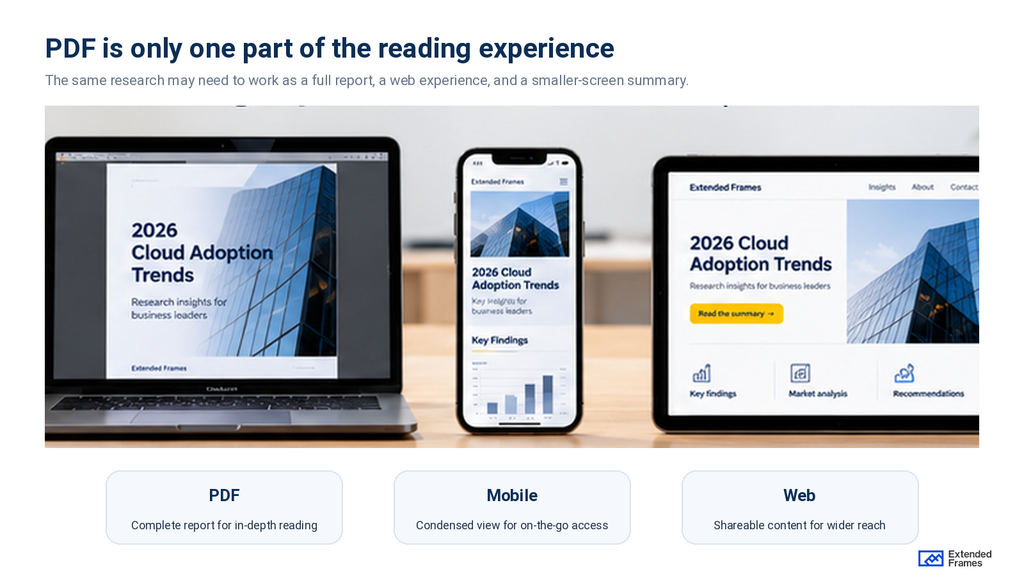
B2B teams frequently publish whitepapers as downloadable PDFs. That makes sense when a report needs a stable layout, a defined edition, or a format that can be circulated internally.
But the PDF shouldn’t be the only consideration. Someone may discover the report on a phone, read the summary on a laptop, or open it later on a larger screen. A fixed layout designed primarily for desktop viewing can become difficult to read on smaller devices.
Before committing to a PDF-only experience, consider whether the content would also benefit from an HTML version or a substantial web summary.
Google’s Search Central documentation confirms that PDFs can be indexed. However, indexability alone doesn’t settle the question of which format offers the better reading experience.
For reports intended to support ongoing search traffic, a structured web page may make it easier to navigate the content, provide contextual links, and maintain updated information.
A downloadable PDF can still be available for readers who need the complete publication.
Accessibility needs to survive the export
Accessibility should be considered during layout and checked again in the final document.
The World Wide Web Consortium’s PDF guidance explains how incorrect reading order can make a document difficult to understand for people using assistive technology.
A visually clear two-column page, for example, may be read in the wrong sequence if its PDF structure is incorrect.
Heading tags, reading order, meaningful alternative text, sufficient contrast, and navigable links should be reviewed in the exported file.
A report that is difficult to access is also harder to use, regardless of how carefully its pages have been designed.
What should happen before the design brief?
Bringing designers into the process earlier can help identify structural problems before the content becomes difficult to change.
That earlier structural work is also where creative consulting can be useful, before the project becomes primarily a production task.
They don’t need to attend every research meeting. But they should understand the audience, the central argument, the type of evidence available, and how the finished report is expected to be used.
For a substantial B2B whitepaper, a useful handoff should include the approved research and source material, the intended audience, the principal findings, and any claims that require qualification.
It should also identify who can make editorial decisions during production. Without that responsibility being clear, even small changes can become difficult.
A designer may discover that a chart needs additional data, but nobody knows who can approve the revised explanation. Marketing may request a shorter executive summary while a subject-matter specialist insists that every qualification remain in the opening section.
These disagreements are easier to resolve when the team has agreed on the report’s purpose and assigned decision-making authority.
The wider question of accountability is explored in Extended Frames’ article on brand governance and content ownership.
When is the whitepaper ready to publish?
The final review should go beyond visual consistency and proofreading.
Someone unfamiliar with the project should be able to open the report, locate the principal findings, understand the evidence, and distinguish research conclusions from the company’s recommendations.
The team should also check how the report performs at realistic viewing sizes, whether chart labels and source notes remain readable, and whether the PDF’s links and navigation work.
Where possible, have a representative reader try to answer a few genuine questions using the document. Note where they hesitate or interpret something incorrectly.
That feedback is more useful than another round of subjective comments about whether a page feels visually balanced.
Give readers a reason to keep the report
A whitepaper represents a significant investment in research, writing, review, and production. It is reasonable to expect more from it than a professional-looking document at the end of the process.
The report should help its intended audience understand a subject more clearly and return to the findings when they need them.
That requires editorial decisions about what deserves space, discipline in how evidence is presented, and design that makes complex information easier to work with.
A useful question before publication is whether someone could take a single important finding from the report and explain it accurately to a colleague.
If they can’t, the content or presentation may still need work.
Extended Frames works with B2B marketing and business teams to develop clear, professionally designed whitepapers, research reports, eBooks, and other complex documents.
If you’re preparing a report or have an existing draft that needs stronger structure and visual direction, explore our creative design services.